


The Indian Health Service has updated its coronavirus data, showing COVID-19 vaccination distribution and administration as of June 11, 2021.
According to the data, the IHS has distributed 1,748,665 COVID-19 vaccine doses across 11 areas of Indian Country. Of that amount, 1,409,859 have been administered, representing 80.6 percent of the total.
The number of vaccines distributed did not increase at all from the week prior, according to the figures. The number of vaccines administered increased by nearly 1.6 percent.
The data shows the Oklahoma City Area has received the largest number of vaccines. The 440,160 doses account for about 25.2 percent of the total. Of that amount, 81.2 percent have been administered in the region.
With 249,605 doses distributed, the Navajo Area comes in second, accounting for nearly 14.3 percent of the total across the IHS. Of those, 90.7 percent have been administered in the region.
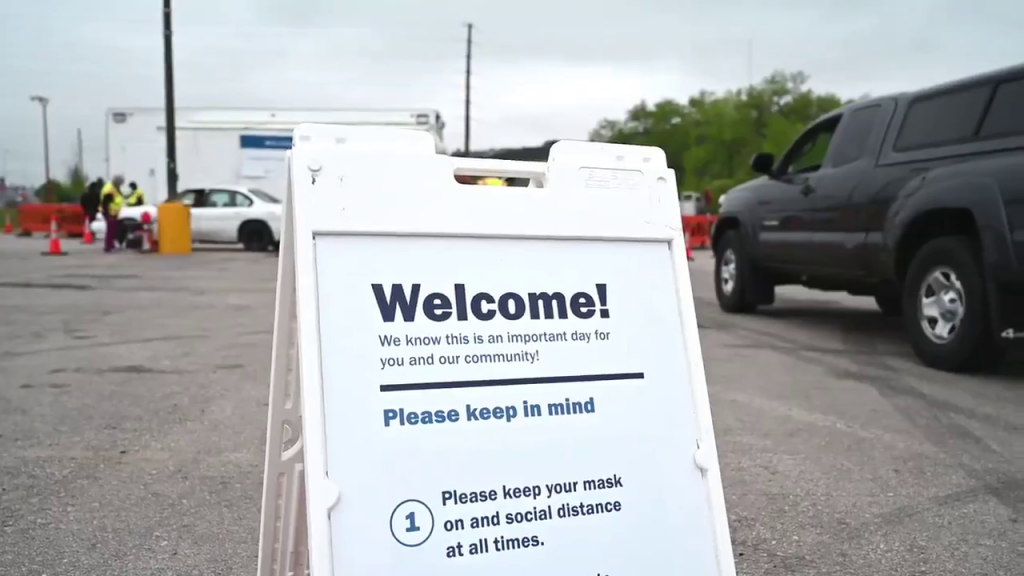
It's a wrap on our @FEMA/@IHSgov Great Plains Mobile Vaccination Unit Tour!
Over a six week period, we made two different stops in 13 communities across North Dakota and South Dakota, to make vaccines more accessible to tribal communities. pic.twitter.com/mZIsExxyWv
— FEMA Region 8 (@femaregion8) June 11, 2021
According to the IHS, vaccination distribution and administration will be updated weekly across the 11 areas that are receiving doses directly from the agency.
Tribal health facilities in Alaska have chosen to receive their COVID-19 vaccine supplies from the state, so their region is not included in the data.
COVID-19 Vaccine Distribution and Administration by IHS Area
As of June 11, 2021, the IHS is distributing vaccine allocations of the Pfizer, Moderna, and Johnson & Johnson/Janssen vaccine. The table below shows the total number of vaccine doses distributed and administered per IHS Area to date. The overall administration rate for the IHS jurisdiction is 80 percent however, Area administration rates vary. For example, Albuquerque Area is reaching nearly 100 percent administration rate which may be due to vaccine overfill in the vials for both Pfizer and Moderna products. In accordance with FDA guidance, all available full doses may be administered.
| Area | Total Doses Distributed* | Total Doses Administered** |
|---|---|---|
| Albuquerque | 131,065 | 129,125 |
| Bemidji | 151,235 | 121,104 |
| Billings | 59,995 | 43,546 |
| California | 220,205 | 148,537 |
| Great Plains | 125,730 | 86,274 |
| Nashville | 89,955 | 69,508 |
| Navajo | 249,605 | 226,450 |
| Oklahoma City | 440,160 | 357,348 |
| Phoenix | 172,900 | 145,941 |
| Portland | 95,745 | 73,607 |
| Tucson^ | 12,070 | 8,419 |
| Grand Total | 1,748,665 | 1,409,859 |
*Distributed Data Source: IHS National Supply Service Center, includes total doses ordered and anticipated to be delivered by June 11, 2021.
**Administered Data Source: CDC Clearinghouse data from Vaccine Administration Management System (VAMS) and IHS Central Aggregator Service (CAS). Data in the CDC Clearinghouse reflects prior day data. Data may be different than actual data as there are known CDC data lags and ongoing quality review of data including resolving data errors.
^The Tucson Area vaccine administration data is currently being validated.
Note: Alaska Area – all tribes chose to receive COVID-19 vaccine from the State of Alaska.
Source: Indian Health Service (https://www.ihs.gov/coronavirus)